Attention subscribers
-
Already a subscriber but can’t log in? Click here to locate your subscription and set up online access. If you’ve tried this and still can’t sign in, contact your local office or email info@richardsonmediagroup.net.
Innovation can attract investment and reshape economies. The U.S. Economic Development Administration identifies innovation as a driver of global competitiveness, job creation and economic growth. However, innovation activity varies substantially by region. Some states generate more patents, support greater research and development activity, and attract more venture capital than others, giving them a stronger foundation for developing and commercializing new ideas.
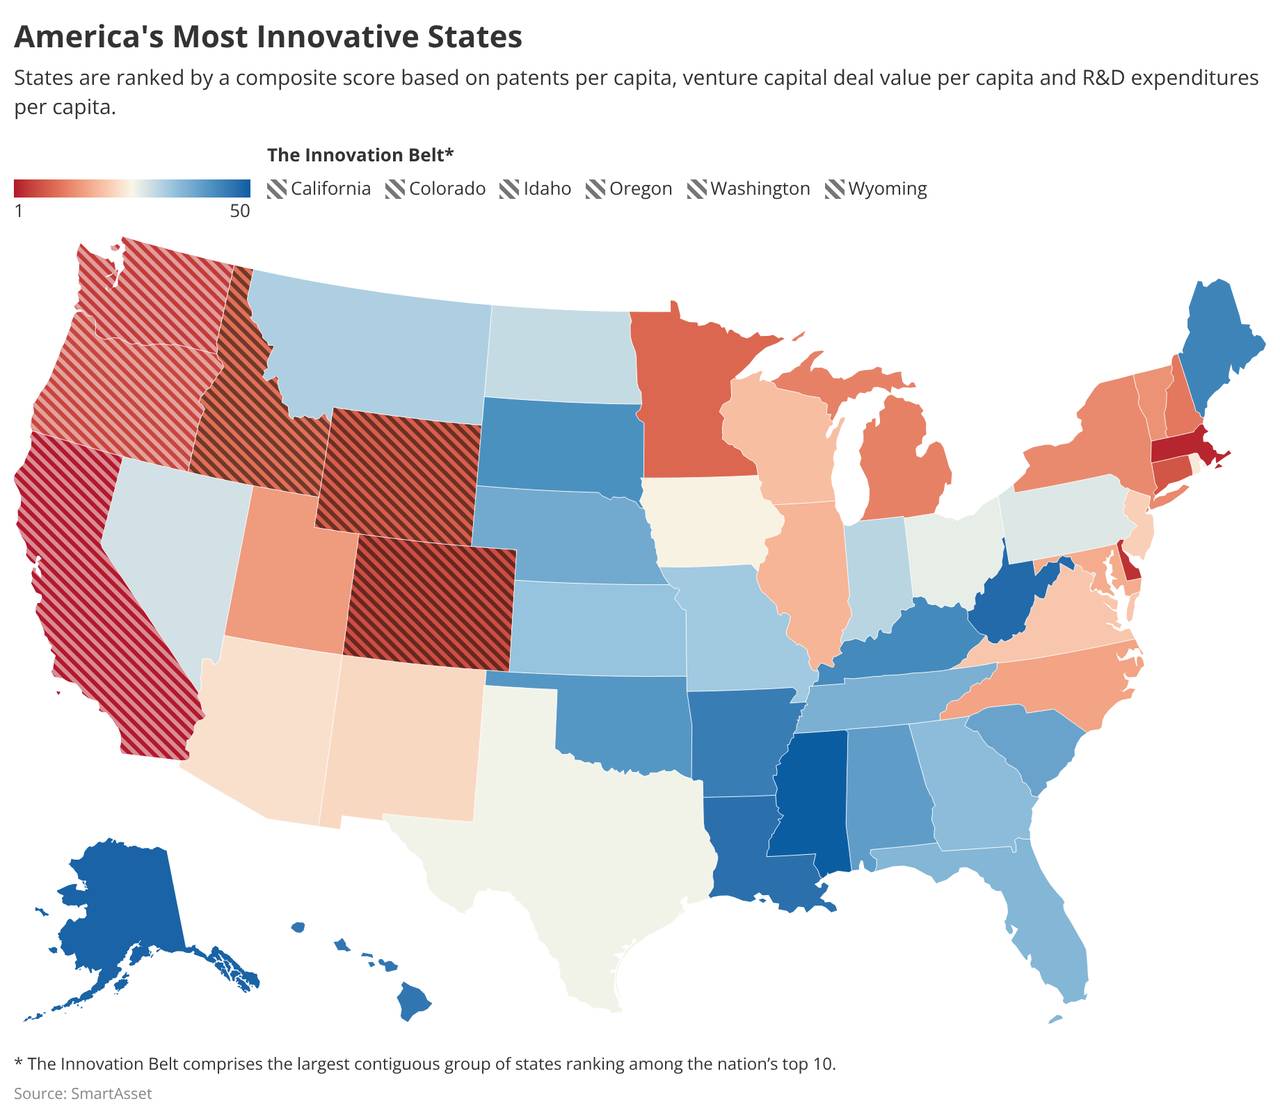
SmartAsset analyzed the 50 states to identify where innovation activity was most concentrated. The analysis examined three per capita metrics: patents issued; research and development expenditures by businesses, universities and government agencies; and venture capital (VC) deal value — the total amount invested in startup companies through VC transactions. The metrics were combined into a composite score used to rank each state.
Key Findings
Six Western states form America’s “Innovation Belt.” California (No. 1), Washington (No. 4), Oregon (No. 5), Colorado (No. 6), Wyoming (No. 8) and Idaho (No. 10) make up the largest contiguous group of states ranked in the top 10.
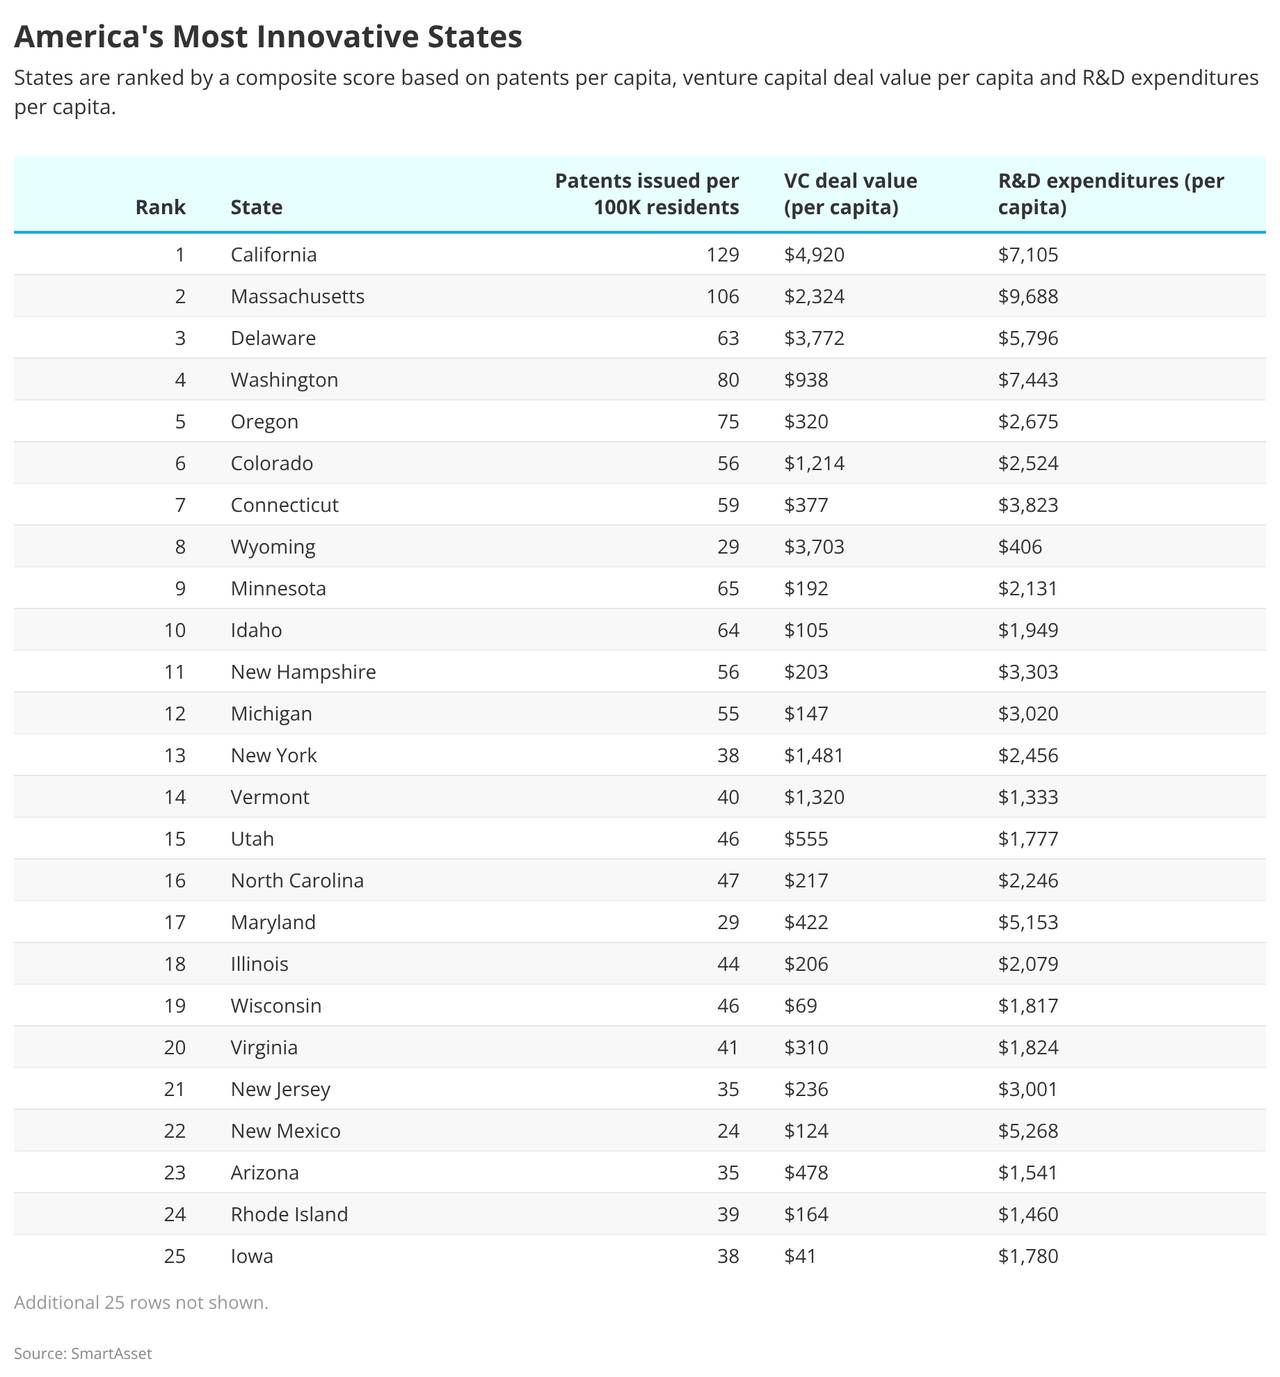
The gap between the highest- and lowest-ranked states is substantial. No. 1 California attracted nearly $5,000 in venture capital per capita and produced 129 patents per 100,000 residents. By contrast, No. 50 Mississippi attracted only $2 per capita and produced four patents per 100,000 residents.
States rank highly in different innovation strengths. Massachusetts leads in research and development spending per capita. Venture capital drives the rankings of Delaware and Wyoming, while Washington combines high patent activity with substantial research spending.
Innovation does not require a startup-heavy ecosystem. Idaho ranked in the top 10 despite attracting relatively little venture capital. Its performance was driven by significant research and development spending — including more than $600 million through Idaho National Laboratory — as well as relatively high patent activity supported by established companies such as Micron and HP.
SmartAssetSmartAsset
15 Most Innovative States
1. California
Patents issued per 100,000 residents: 129
Venture capital deal value per capita: $4,920
R&D expenditures per capita: $7,105
2. Massachusetts
Patents issued per 100,000 residents: 106
Venture capital deal value per capita: $2,324
R&D expenditures per capita: $9,688
3. Delaware
Patents issued per 100,000 residents: 63
Venture capital deal value per capita: $3,772
R&D expenditures per capita: $5,796
4. Washington
Patents issued per 100,000 residents: 80
Venture capital deal value per capita: $938
R&D expenditures per capita: $7,443
5. Oregon
Patents issued per 100,000 residents: 75
Venture capital deal value per capita: $320
R&D expenditures per capita: $2,675
6. Colorado
Patents issued per 100,000 residents: 56
Venture capital deal value per capita: $1,214
R&D expenditures per capita: $2,524
7. Connecticut
Patents issued per 100,000 residents: 59
Venture capital deal value per capita: $377
R&D expenditures per capita: $3,823
8. Wyoming
Patents issued per 100,000 residents: 29
Venture capital deal value per capita: $3,703
R&D expenditures per capita: $406
9. Minnesota
Patents issued per 100,000 residents: 65
Venture capital deal value per capita: $192
R&D expenditures per capita: $2,131
10. Idaho
Patents issued per 100,000 residents: 64
Venture capital deal value per capita: $105
R&D expenditures per capita: $1,949
11. New Hampshire
Patents issued per 100,000 residents: 56
Venture capital deal value per capita: $203
R&D expenditures per capita: $3,303
12. Michigan
Patents issued per 100,000 residents: 55
Venture capital deal value per capita: $147
R&D expenditures per capita: $3,020
13. New York
Patents issued per 100,000 residents: 38
Venture capital deal value per capita: $1,481
R&D expenditures per capita: $2,456
14. Vermont
Patents issued per 100,000 residents: 40
Venture capital deal value per capita: $1,320
R&D expenditures per capita: $1,333
15. Utah
Patents issued per 100,000 residents: 46
Venture capital deal value per capita: $555
R&D expenditures per capita: $1,777
Methodology
For each state, a composite score was calculated using three weighted metrics: 2025 venture capital deal value, as reported by the PitchBook-NVCA Venture Monitor; patents issued by the U.S. Patent and Trademark Office to residents during fiscal year 2025; and 2023 research and development expenditures across all performing sectors, as reported by the National Center for Science and Engineering Statistics. Each metric used the most recent comparable data available and was calculated per capita using U.S. Census Bureau population estimates for the corresponding year. The three per-capita metrics were normalized and combined to produce the composite score. States were ranked from No. 1 to No. 50, with higher scores indicating greater innovation activity. Source data providers are not affiliated with, and do not endorse or sponsor, this study or its findings.